Recently Sam Gregory, a writer for Sportsnet in Canada, published a blog at OptaPro that examined the relationship between shots and variation in attack. I want to say first of all that I have a lot of respect for Sam. If and when I expand this business, Sam is exactly the sort of promising young analyst I’ll want to hire. He has a great understanding of both soccer and statistics. In this case, however, we differ markedly in how we’d take on the topic in question.
Sam’s approach was to use a linear regression, where he was estimating this equation:
![]()
Essentially, the idea was to see how much the total for each type of attack contributed to shots, and then to see if variation in attack (for which Sam created an index) had any effect on shots above and beyond these totals.
The problem, as I see it, is that the equation above is not a structural model of shots. It is not a breakdown of shots into clear components that together, with full information, would explain shots completely. Rather, it is an equation that tries to estimate the fit of a bunch of variables that might be related to shots.
Why should this matter? Sam is just looking for a statistical relationship, after all. But the chance that the relationship he finds is spurious increases without a structural model. For example, shares on the New York Stock Exchange tend to lose value when a team from the AFC wins the Super Bowl. That’s a statistical relationship, but, in the absence of a model connecting American football results to share prices, most econometricians would consider it spurious. The relationship has explanatory power but, at least in theory, no predictive power.
Here’s an example of a structural model for shots:
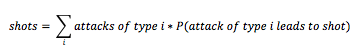
In this equation, the probabilities P for each type of attack could be a function of many variables, including Sam’s index of variation. The functions needn’t be the same for each type of attack, either. In Sam’s equation, it looks like the coefficients on the attack totals correspond to these probabilities – but then his index of variation enters the equation on its own, too. In other words, the true effect of the index is shared between all the β coefficients in the equation.
I wrote to Sam about this, and he replied that his index of variation wasn’t correlated with the attack totals. He took this to mean that the index of variation wasn’t part of the functions for the probabilities P. But that’s not necessarily the right conclusion, especially if the other variables that enter those functions can affect the relationship.
The way to test this is to look at those functions explicitly. Instead of estimating the total number of shots, I wanted to see what dictated whether a specific type of attack would result in a shot. To do this, I had to guess what other variables might enter the functions besides an index of variation.
To avoid a deterministic model, where the outcomes were a foregone conclusion, I decided to look only at information available at the start of the attack. Sam defined an attack as “any possession that ends in a shot or an opponent’s defensive action inside the 18 yard box.” I didn’t want to define an attack by how it ended; that also seemed overly deterministic to me. So, as an alternative, I used any possession involving at least three consecutive touches – ball-winning, passes, take-ons, and shots – by the same team. If a team is controlling the ball, I think it’s fair to say they’re going to be attacking.
Teams regularly attack with combinations of long balls, crosses, short passes, and through balls. But to calculate an index of variation like Sam’s, I had to attach percentages to each type that summed to one. So I made an order of priority reflecting the one in Sam’s piece: first crosses, then build-ups, through balls, and long balls.
My explanatory variables for the probabilities P were the distance upfield when the attack began and the position played by the first person starting the attack (as an indicator of how many other players had gotten forward). To these I added an index of variation, but not Sam’s index based on the Gini coefficient. The problem with the Gini coefficient in this context is that it takes on different values depending on how you order its components. To avoid ambiguity, I used a Herfindahl-Hirschman index instead.
In thinking about how variation in attack might affect the likelihood of generating a shot, I came to the conclusion that what mostly mattered was variation within the same match. Defending players probably aren’t too confused or imbalanced because of what an attacking team did three weeks ago; what happens during a match probably affects their behavior much more than what they saw on videotape. So my index of variation was continuously updated during each match to reflect the defenders’ experience.
I realize that this list of explanatory variables isn’t complete or even necessarily correct, but it’s a start. For my first estimates, I used logistic regressions for the probability of a each type of attack resulting in a shot. My data were from the 2014-15 English Premier League. In the regressions for attacks featuring (1) a cross or (2) a through ball with no cross, the coefficient on the index of variation was small and extremely unlikely to be different from zero. In the regressions for (3) build-ups with no cross or through ball, (4) long balls with no cross, through ball, or build-up, and (5) attacks not otherwise classified, the coefficient was large, negative, and, in each case, estimated to be different from zero with 99% confidence.
Possible rationales for these results are that crosses are easy to anticipate and mostly test defenders’ ability to jump for headers, and through balls are so rare that they mostly test goalkeepers’ ability to shut down onrushing attackers. As a result, events earlier in the game don’t matter much in either case. By contrast, build-ups involve many possible nodes of uncertainty, where players might pass, cross, or shoot the ball. The more variation a team has shown in attack, the more uncertainty may be implied in defenders’ prior beliefs about what the attackers will do. Long-ball attacks may have a similar effect if the receiving player’s actions – pass, shoot, dribble – are unpredictable.
I find these rationales somewhat unsatisfying, though, because the attacks are classified partly by how they proceeded and partly by how they ended. If I throw out these distinctions and put all the attacks together into one big regression, the coefficient on the index of variation is large, negative, and different from zero with greater than 99.9% confidence. Looking at other seasons, the results are almost identical across the board.
It’s worth noting that the index of variation starts every match at one for all teams and – all other things equal – falls faster the more often teams attack. If teams that attack more often are also more likely to turn attacks into shots, then the index of variation could be proxying for relative team quality early in matches. Looking only at the second halves of matches (when the index of variation is typically lower and stable for all teams), the effect becomes slightly weaker. By this point, defenders may already have seen enough of the attacking teams’ options to know what was coming.
A final test is to look at whether the importance of variation in attack differs across teams. It does. Teams including Arsenal, Hull City, and Manchester United seem to benefit much more from variation. If they have reputations for sticking to only one set of tactics, then variation might come as more of a surprise to defenders. Other teams like Aston Villa and Southampton don’t gain much from variation; perhaps defenders facing the Villans and Saints know they need to be ready for anything.
Based on this analysis, it certainly seems like variation in attack enhances the likelihood of generating a shot for some teams. But I’m still conscious that my model is missing many factors that could affect this dynamic. I’ve devoted a few hours to this question, and I’ll look forward to someone else doing a more detailed study.