In my last article, I showed how the value of a goal scored or conceded in the English Premier League could vary enormously depending on the likely position of a team in the table. For many teams, the value of scoring one more goal could also differ from the value of conceding one less goal at any given position. But my first analysis considered goals scored and goals conceded separately when predicting where a team would finish. What if we considered them together?
To answer this question, I used a technique called k-nearest-neighbor analysis* to construct a grid of likely payoffs based on hypothetical goal records. The grid measures 100×100, so teams can score or concede up to 100 goals. (It’s true that Carlo Ancelotti’s Chelsea scored 103 goals, but it doesn’t really affect the analysis.) Using the same 18 seasons of data as in my earlier analysis, I assigned teams probabilities of different finishes based on their goal records.** Then I computed expected revenues five years into the future, relative to a generic Premier League finish, based on those possible finishes. For the five-year projections, I used the same Bayesian strategy as in the previous one-way analysis.
This is what the expected payoffs look like in millions of pounds across the 100×100 grid:

As anyone who follows the Premier League knows, there are huge amounts of money at stake here. Teams want to be in the northeast corner of the grid, where goals scored are high and goals conceded are low; this is where the biggest payoffs are. Notice that the bands are fairly wide in most areas, meaning that the change in expected payoffs is gradual as a team’s goal record changes. As a result, the value of a goal is likely to be pretty constant except in areas where the bands are narrow or near the borders of the bands. And it’s no coincidence that the bands are narrow in the areas where teams are on the cusp of qualifying for European competitions or claiming the trophy.
The key metric in figuring out how much a goal is worth is the change in the expected payoff if a team moves from one location to another on the grid. On the graphs below, this means moving one unit to the right for an additional goal scored, or one unit up for one less goal conceded.
It’s worth noting that the data are pretty noisy and not always consistent. A goal record that resulted in Champions League soccer one year might send a team to the Europa League in the next. Also, teams with worse goal records sometimes finished higher in the table if they happened to score and concede at exactly the right moments; to see this, we only have to compare Tottenham and Liverpool last season, as I have below. This apparent paradox can lead the algorithm to attach a negative value to an additional goal scored or one less goal conceded.
Here is the grid showing the value of scoring one more goal, in millions of pounds:
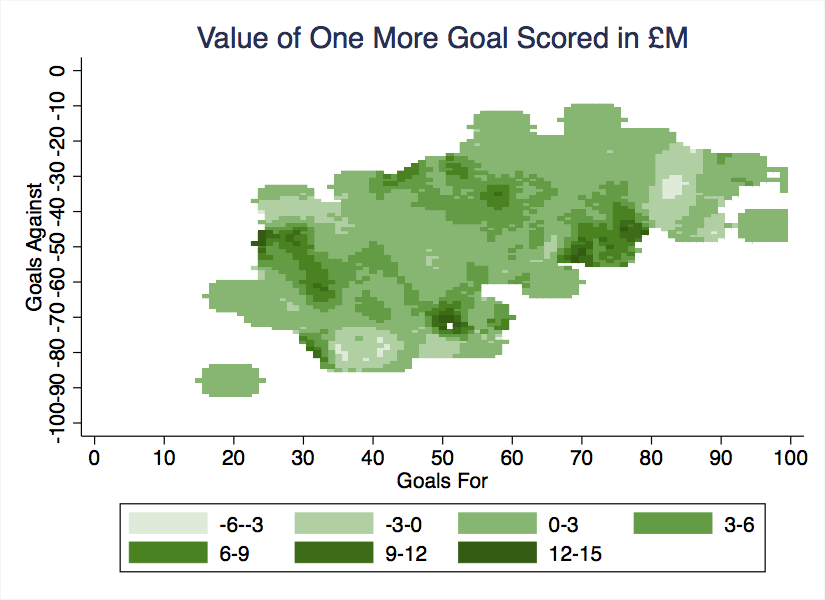
As expected, the value of a goal is fairly constant in much of the grid, varying between £0 and £3 million. But there are two dark bands running from northwest to southeast. One represents the relegation frontier, and the other is the frontier for access to European soccer. In these areas, the value of an additional goal scored can exceed £12 million.
The white dot in the middle of the relegation frontier occurs at 51 goals for and 73 goals against; this is where a goal has the highest expected value over five years: about £15.7 million. Why are goals so valuable in this region of the grid? To find out, let’s examine some teams that racked up similar goal totals in past years:
English Premier League — Value of a goal
|
Season
|
Team
|
Position
|
Goals For
|
Goals Against
|
|---|---|---|---|---|
| 1995-1996 | Wimbledon | 14 | 55 | 70 |
| 1997-1998 | Sheffield Wednesday | 16 | 52 | 67 |
| 1999-2000 | Wimbledon | 18 | 46 | 74 |
| 2010-2011 | West Bromwich Albion | 11 | 56 | 71 |
| 2010-2011 | Blackpool | 19 | 55 | 78 |
| 2011-2012 | Bolton | 18 | 46 | 77 |
| 2011-2012 | Blackburn | 19 | 48 | 78 |
| 2012-2013 | Aston Villa | 15 | 47 | 69 |
| 2012-2013 | Wigan | 18 | 47 | 73 |
Across the 18 seasons in my analysis, scoring a few goals either side of 51 could have made the difference between finishing 11th and relegation. Five of the nine teams here were relegated, in fact, so the value of goals scored in this region of the grid may indeed be enormous.
Now let’s consider the value of conceding one less goal. Here are the expected five-year payoffs in millions of pounds:
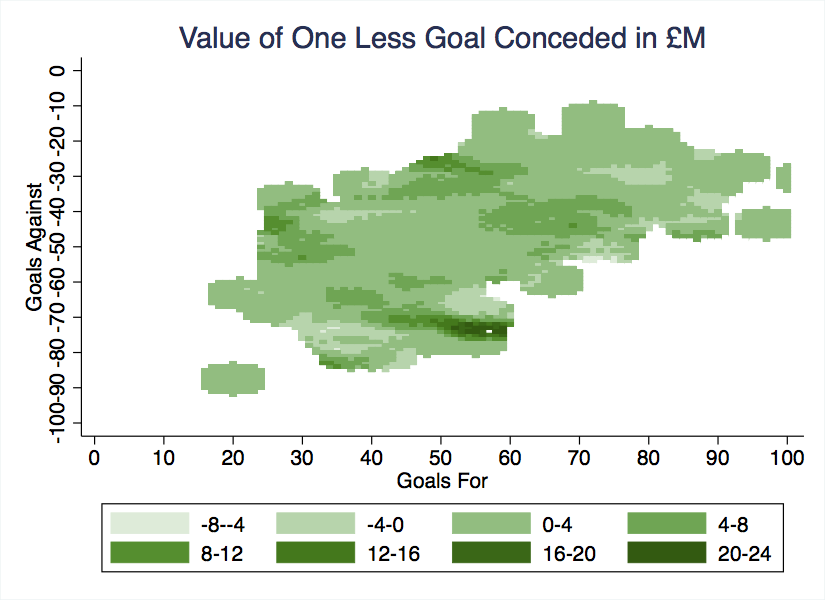
Again, there are two dark bands, and the goal totals where conceding one less would make the biggest difference to revenues are 57 scored and 75 conceded. The teams with similar goal records are pretty much the same as the ones above; relegation is still the major threat. But when we compare the two graphs, some contrasts become clear.
First, in a relegation battle, the value of conceding one less goal is much higher than the value of scoring one more. This makes sense intuitively; teams that concede can lose, while teams that don’t concede – even if they don’t score – can still pick up points from draws. So teams near the bottom of the table would do well to shore up their defense, lest they end up like Blackpool in 2010-11.
The opposite relationship holds for teams trying to qualify for Europe. Though not conceding the marginal goal might be worth £4 to £8 million, scoring the marginal goal could be worth £12 million or more. And then, up at the very top, among the teams in contention to win the Premier League trophy, not conceding becomes important again.
To see how this two-way analysis differs from the one-way analysis I presented in my earlier article, let’s look again at the same teams from last season:
|
Club
|
Goals For
|
Goals Against
|
Position
|
Value of +1 GF (£M)
|
Value of -1 GA (£M)
|
|---|---|---|---|---|---|
| Tottenham | 66 | 46 | 5 | 1.2 | 6.7 |
| Everton | 55 | 40 | 6 | 5.1 | 2.3 |
| Liverpool | 71 | 43 | 7 | 4.5 | 4.3 |
| West Bromwich Albion | 53 | 57 | 8 | 2.6 | 2.7 |
If our baseline forecast were that these teams would have the same goal record this season as last season, then my analysis would have recommended summer spending priorities for at least two of them. Tottenham could have reaped huge profits (in expectation) by strengthening its defense, as Everton needed to score more. For Liverpool, just one unit of improvement along either axis would have been expected to net more than £4 million in additional revenue over five years; West Brom would have gained somewhat less.
These results are quite different from the ones in my earlier one-way analysis. For one thing, there is much more variation in the value of a goal. I think both analyses need to be taken with a grain of salt because of the idiosyncrasies in the data. But many of the conclusions from this two-way analysis seem to ring true when I look at the history of the Premier League. Despite the league’s quirks, considering goals for and goals against at the same time is sure to result in more accurate predictions of places and payoffs.
Can this analysis be even further improved? I plan to continue refining the model and testing its predictions, so please stay tuned.
* In Part I of this series, I hinted that I would use a gravity model to figure out how goal records were likely to translate into final positions in the table. The exponent in the model would have been arbitrarily high, though; Newtonian gravity (exponent = 2) would have given mid-table finishes undue influence on goal records at the extremes. K-nearest-neighbor analysis is also suboptimal, since the most straightforward version doesn’t factor in proximity within neighborhoods. But I decided that this was a less serious problem.
** Can this algorithm be used to predict the final Premier League table based on, say, goal records at the midpoint of the season? With a few tweaks, yes, it can.