One of the hallmarks of good coaching is knowing how to manage a game. Maybe it’s because I grew up in the United States, but I pay special attention to what coaches do at the end of games. In baseball, basketball, and American football, coaches try to control every aspect of the closing stages of a game by stopping play, making substitutions, and using any other trick to either prolong or bring a rapid end to the contest. So how much do soccer coaches do this?
To me, an important marker of a good coach is knowing how to kill a game off. When a team is winning by a goal with not much time left to play, it’s usually time to shut everything down and run out the clock. I’ve always been mystified by José Pékerman’s decision to put on Julio Cruz in the 78th minute of Argentina’s World Cup quarterfinal against Germany in 2006. Cruz was a powerful center forward who played as a target man. With a 1-0 lead, surely the best strategy was to throw on a clever dribbler – some kid named Messi, perhaps? – to run the ball into the corner and waste as much time as possible with the fouls and throw-ins that would inevitably follow.
Using Opta data, it’s fairly easy to get an idea of which coaches’ teams follow this strategy. I looked at the last 100 events for each team in each English Premier League match going back to the 2010-11 season. At an average of 864 events recorded per team and 95 minutes per match, I was looking at roughly the last 11 minutes of each match. For each team, I put the matches where it was leading by a goal at the first of these 100 events into one bucket, and all the other matches went into another bucket.
In each bucket, I looked at how many events were recorded as occurring in the last 20% of the pitch by length and the furthest 20% by width on each flank. On a 105 x 68 meter standard European pitch, these areas would measure 21 meters in length by 13.6 meters in width on each side – essentially rectangular boxes along each sideline, ending at the goal line. Events in these areas were my “corner events”.
Below is a list of coaches who had at least 10 matches leading by a goal as their teams entered their last 100 events. For each one, I’ve shown the average number of corner events when up by a goal versus in all other situations. These numbers aren’t adjusted for the quality of the opposition or the run of play in the match; this is just a quick preliminary analysis.

Soccer analysts and fans alike know that Sam Allardyce, Sunderland’s current manager, likes to use insights from data. I don’t know if data led him to pursue the kill-it-in-the-corners strategy. And I don’t know if he bequeathed the strategy to Owen Coyle at Bolton. But the two of them are the greatest exponents of the strategy that the Premier League has seen in recent years.
Of course, Arsène Wenger is also a big user of data, but he clearly doesn’t use this time-tested strategy. Perhaps his Gunners are so good at passing all over the field that they can run down the clock wherever they want. Not every team can do that. So when my club is up by a goal with 11 minutes left, I know what I want to see.
UPDATE 18 December 2015 – 18h30 EST
Mike Goodman of ESPN suggested that a team’s corner touches and time in the corners may not be related late in games. To deal with this in a quick way, I narrowed the definition of corner events to include only take-ons, passes shorter than 10 meters, fouls suffered, and balls out. The results were very similar:

Interestingly, if I shorten the final stage of the game to 50 events for each team, the number of corner events for the managers near the top of the list drops by less than half. Instead of 4.4 specific corner events per 100, Allardyce has 3.0; for Coyle, it’s 2.5. This suggests that the specific corner events really are a feature of the end of the game.
And finally, if I try to control the study even more by comparing corner events when a goal up to corner events when a goal down, I get the table below:
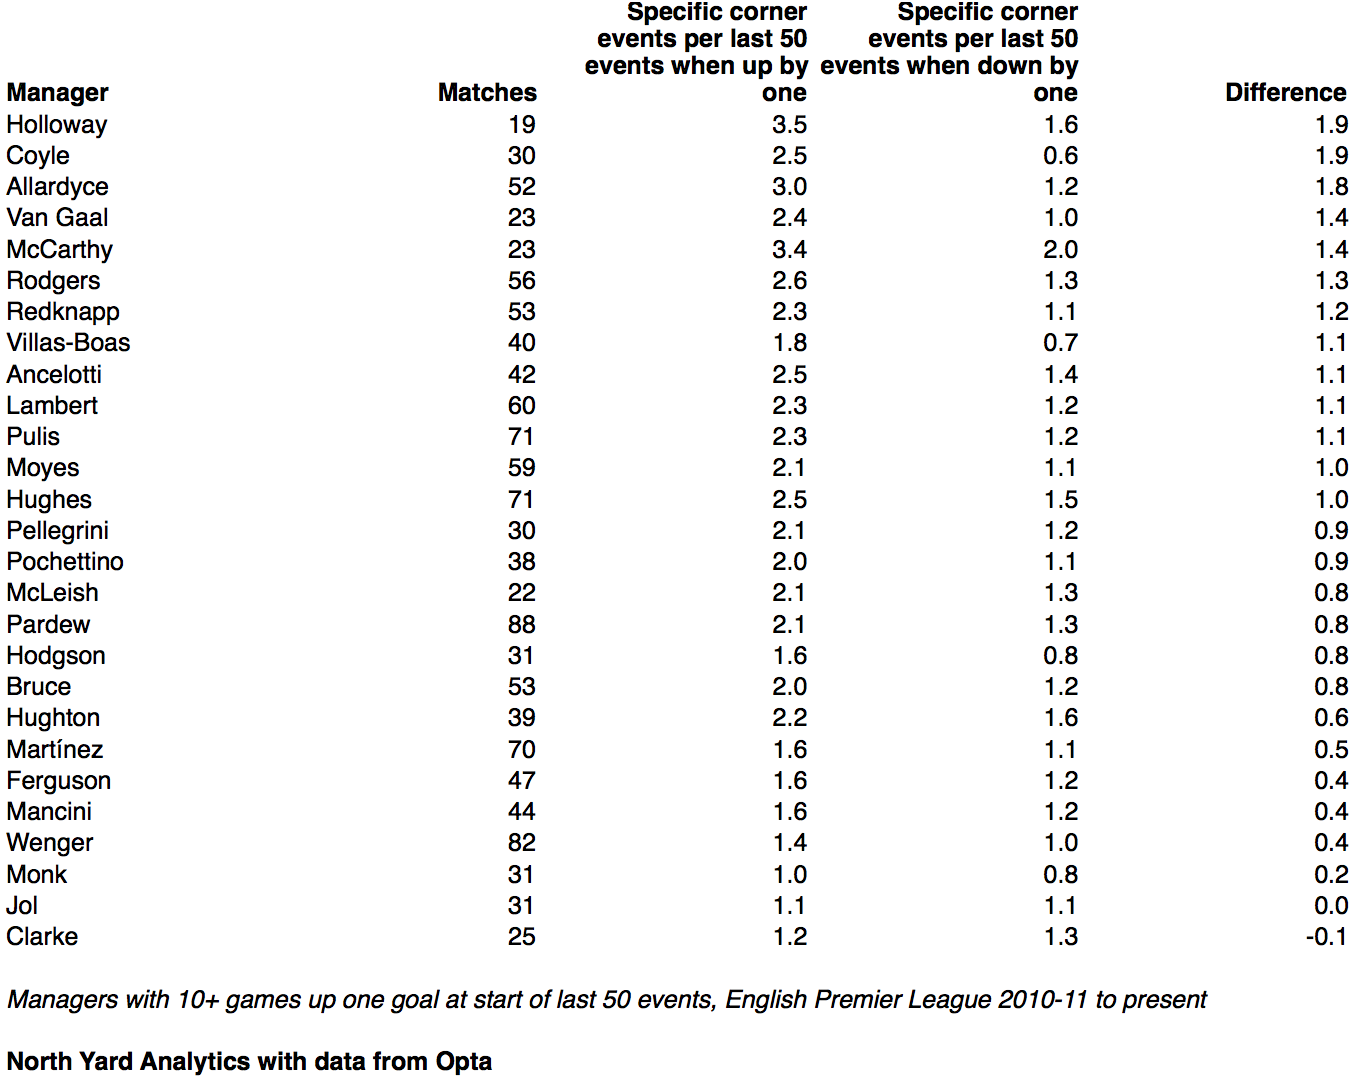
Here the sample size is inevitably smaller, but the results are still pretty intriguing. Further investigation with tracking data – not to mention talking to the managers involved – might confirm my tentative conclusions.